 Atlas login
Reliable population data is crucial in the humanitarian sector for prioritizing life-saving activities. Finding a publicly available population density dataset used to be challenging, especially if you needed consistent global data.
Making population data accessible helps organizations like the Humanitarian OpenStreetMap Team and the Canadian Red Cross identify blank spots on maps or gain more insights into local OSM communities when combined with other datasets. This led us to develop the Kontur Population dataset, which we visualized as a population density map.
Always up-to-date
Continuously refreshed from global sources and Kontur’s own pipeline for reliable, real-time accuracy.
Built for integration
Programmatic access with filters for geography, resolution, and population thresholds. Easy integration into your tools.
Customizable architecture
Flexible architecture to match your needs—whether for disaster response, logistics, or insurance modeling.
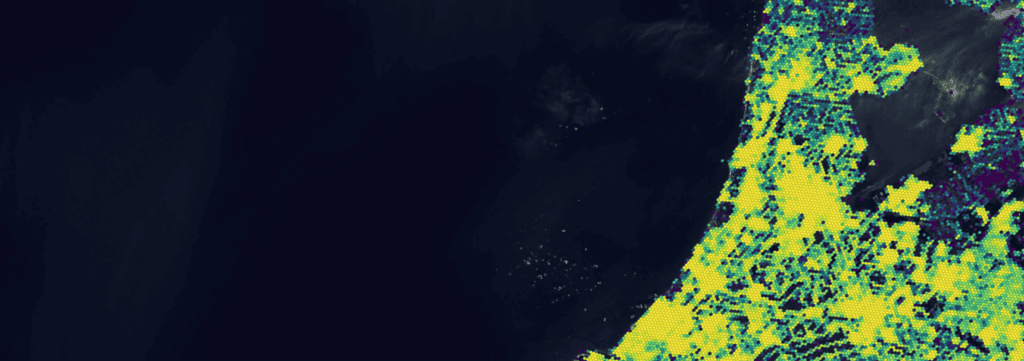
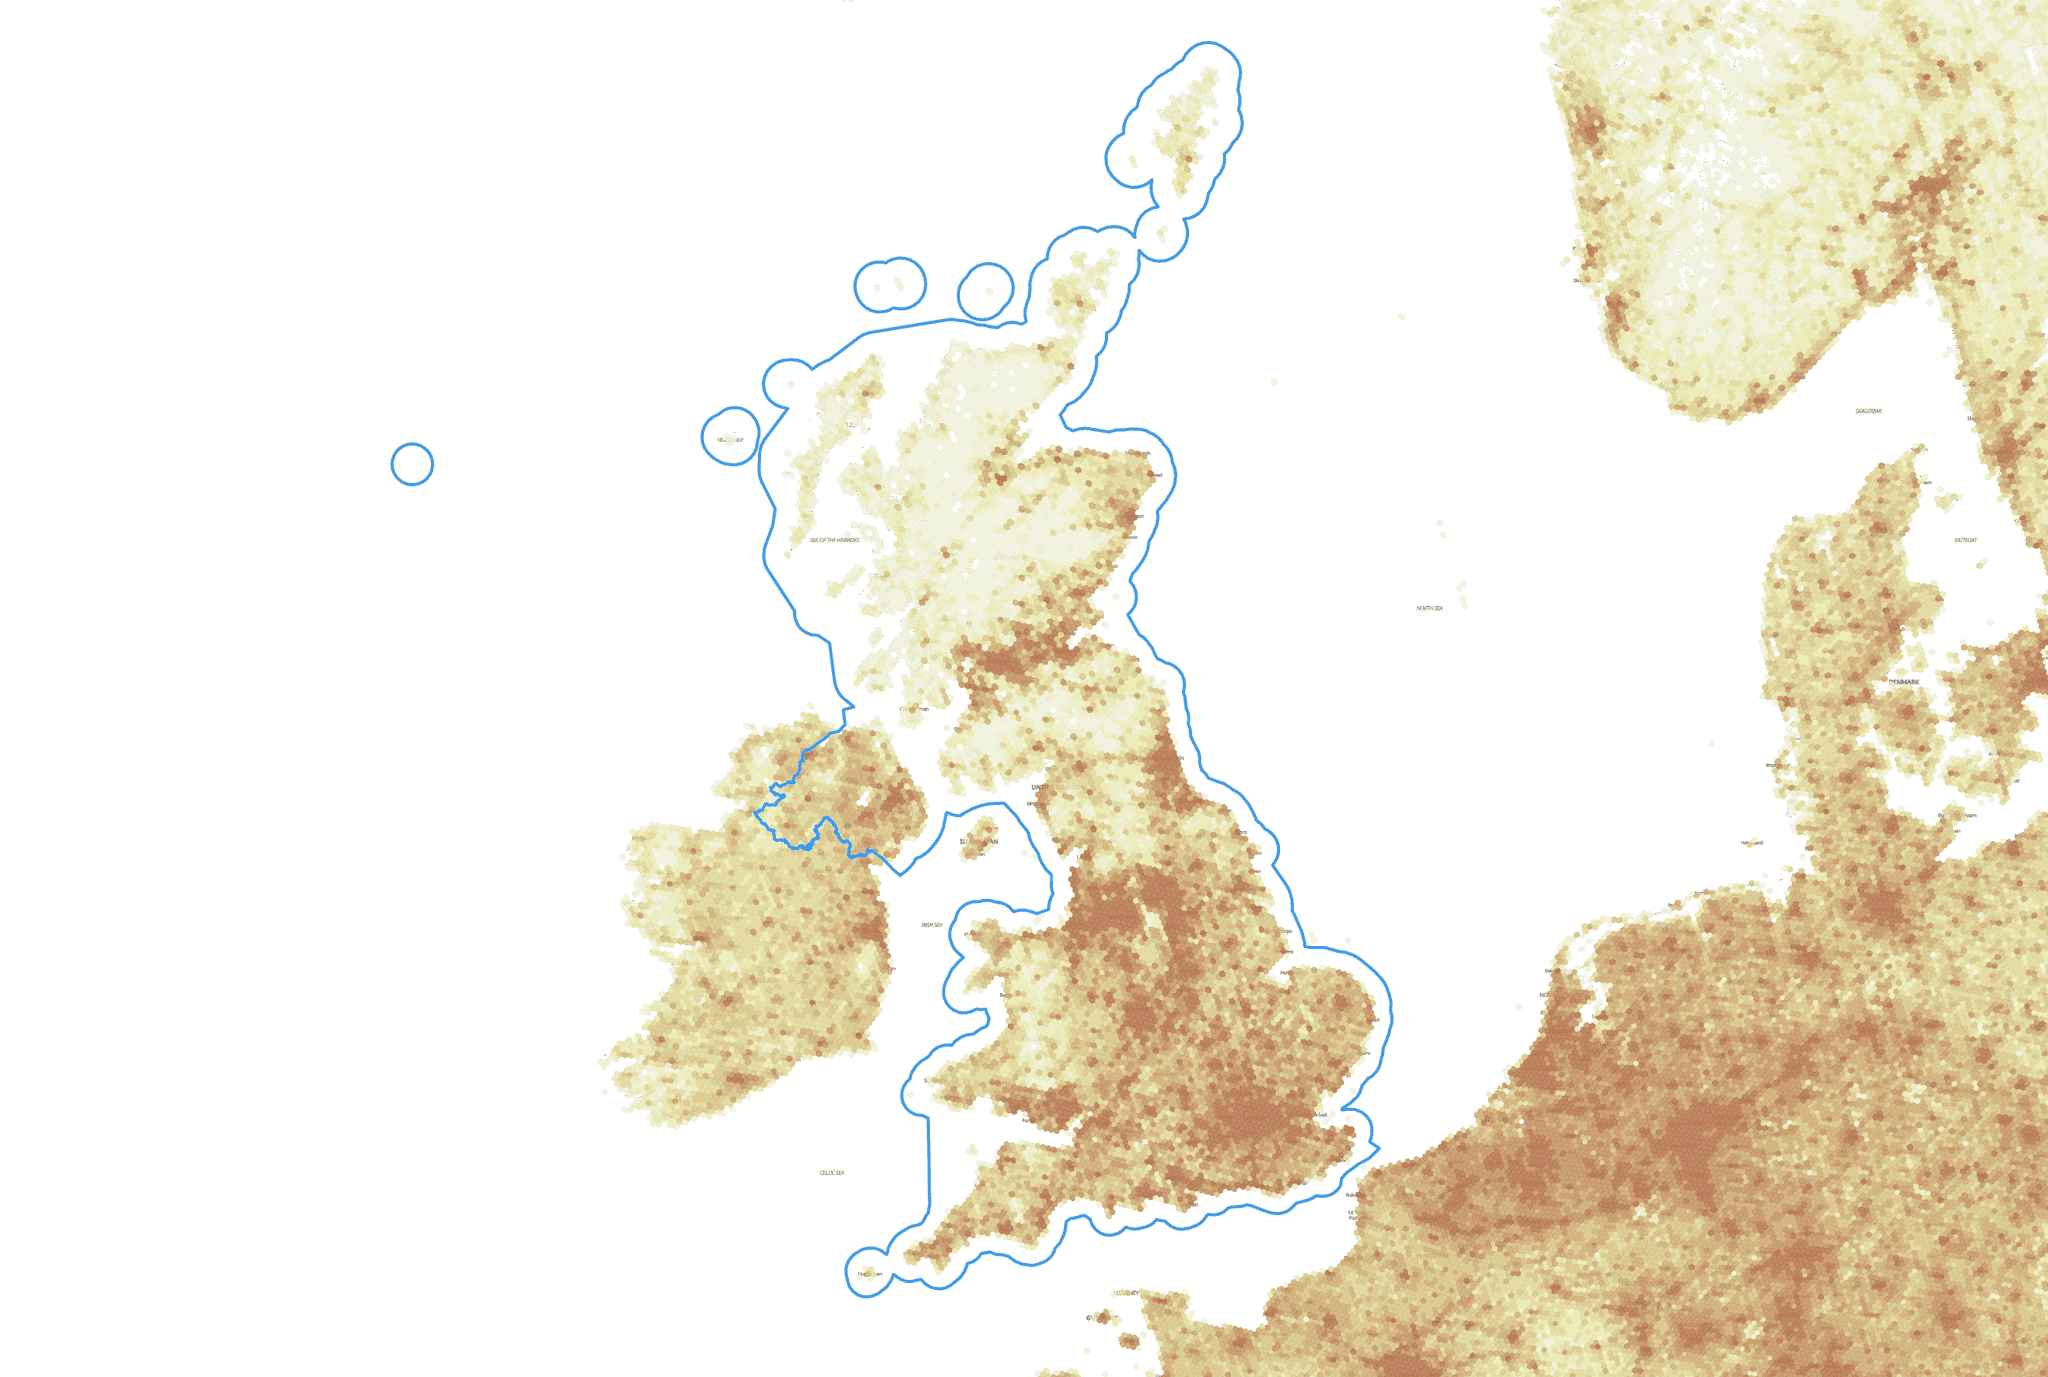
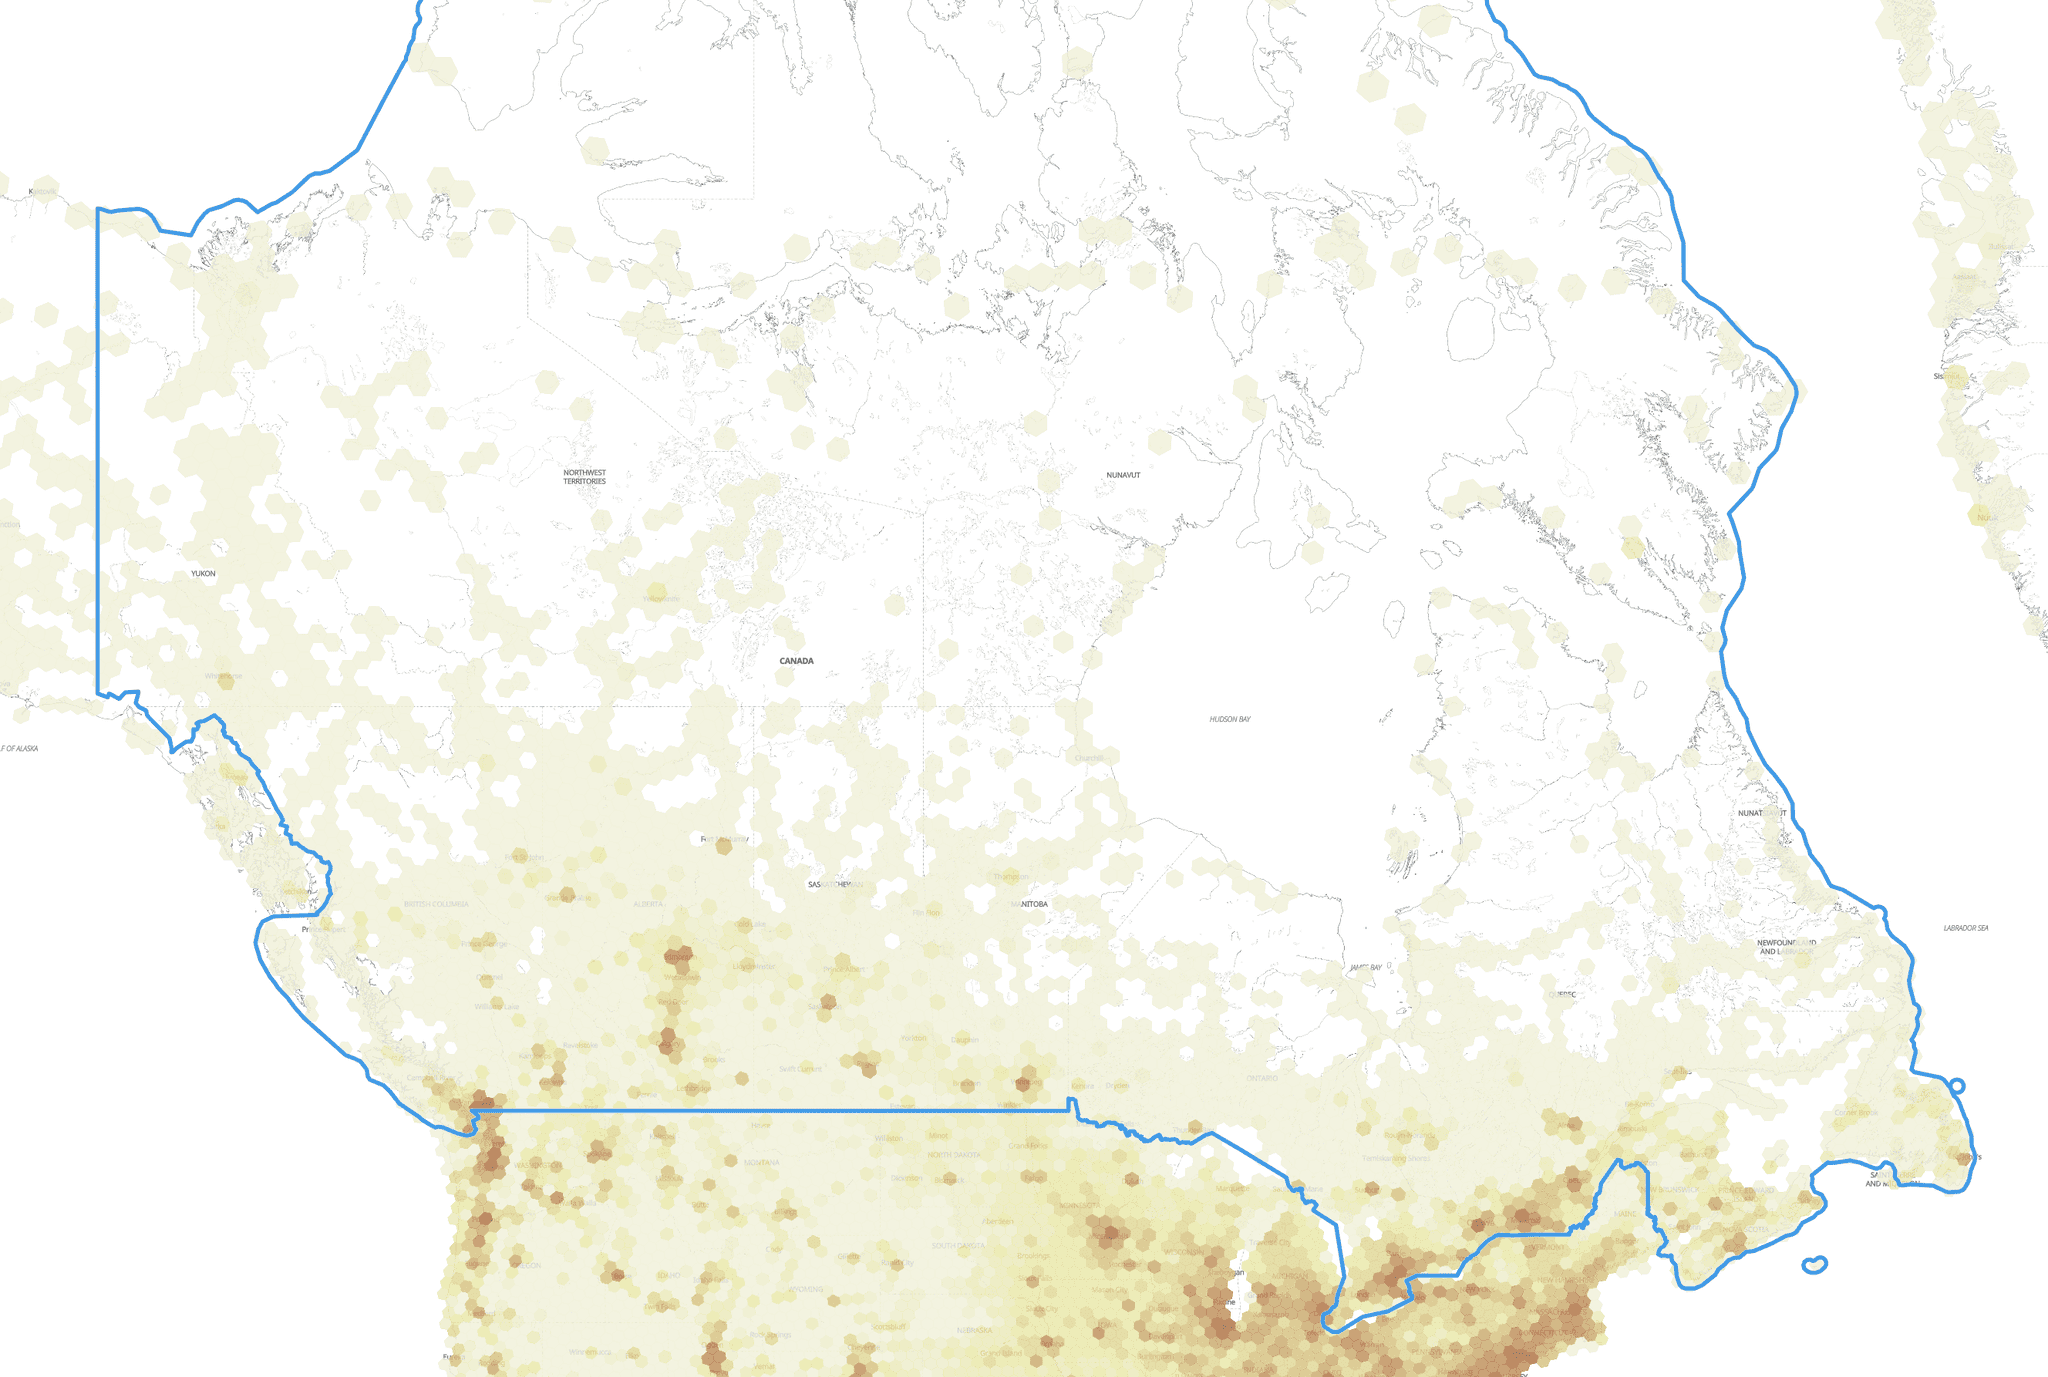
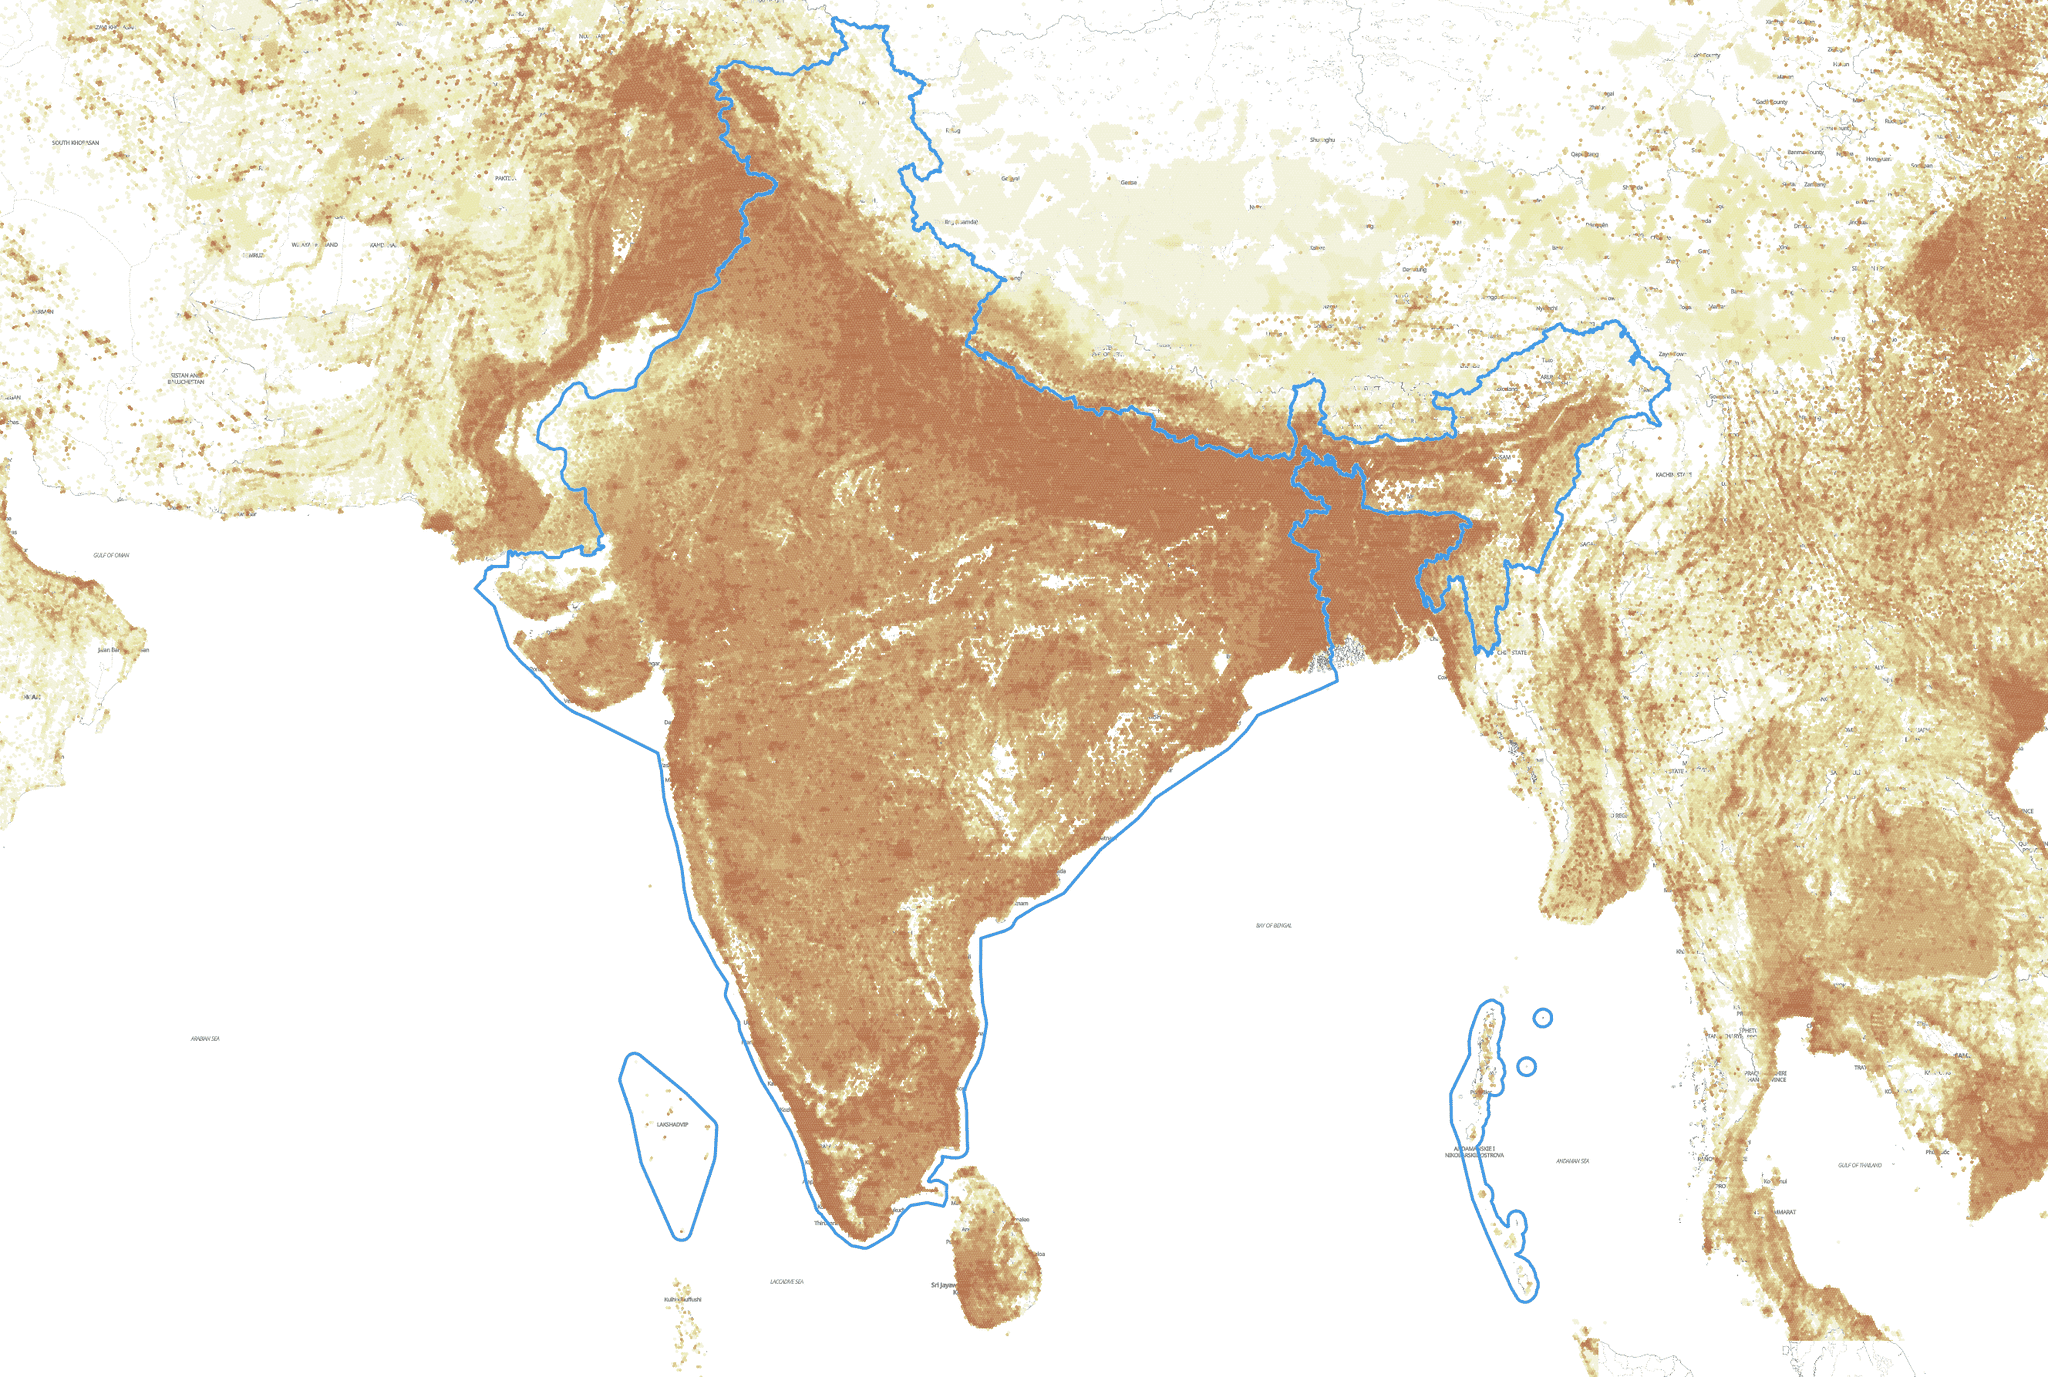
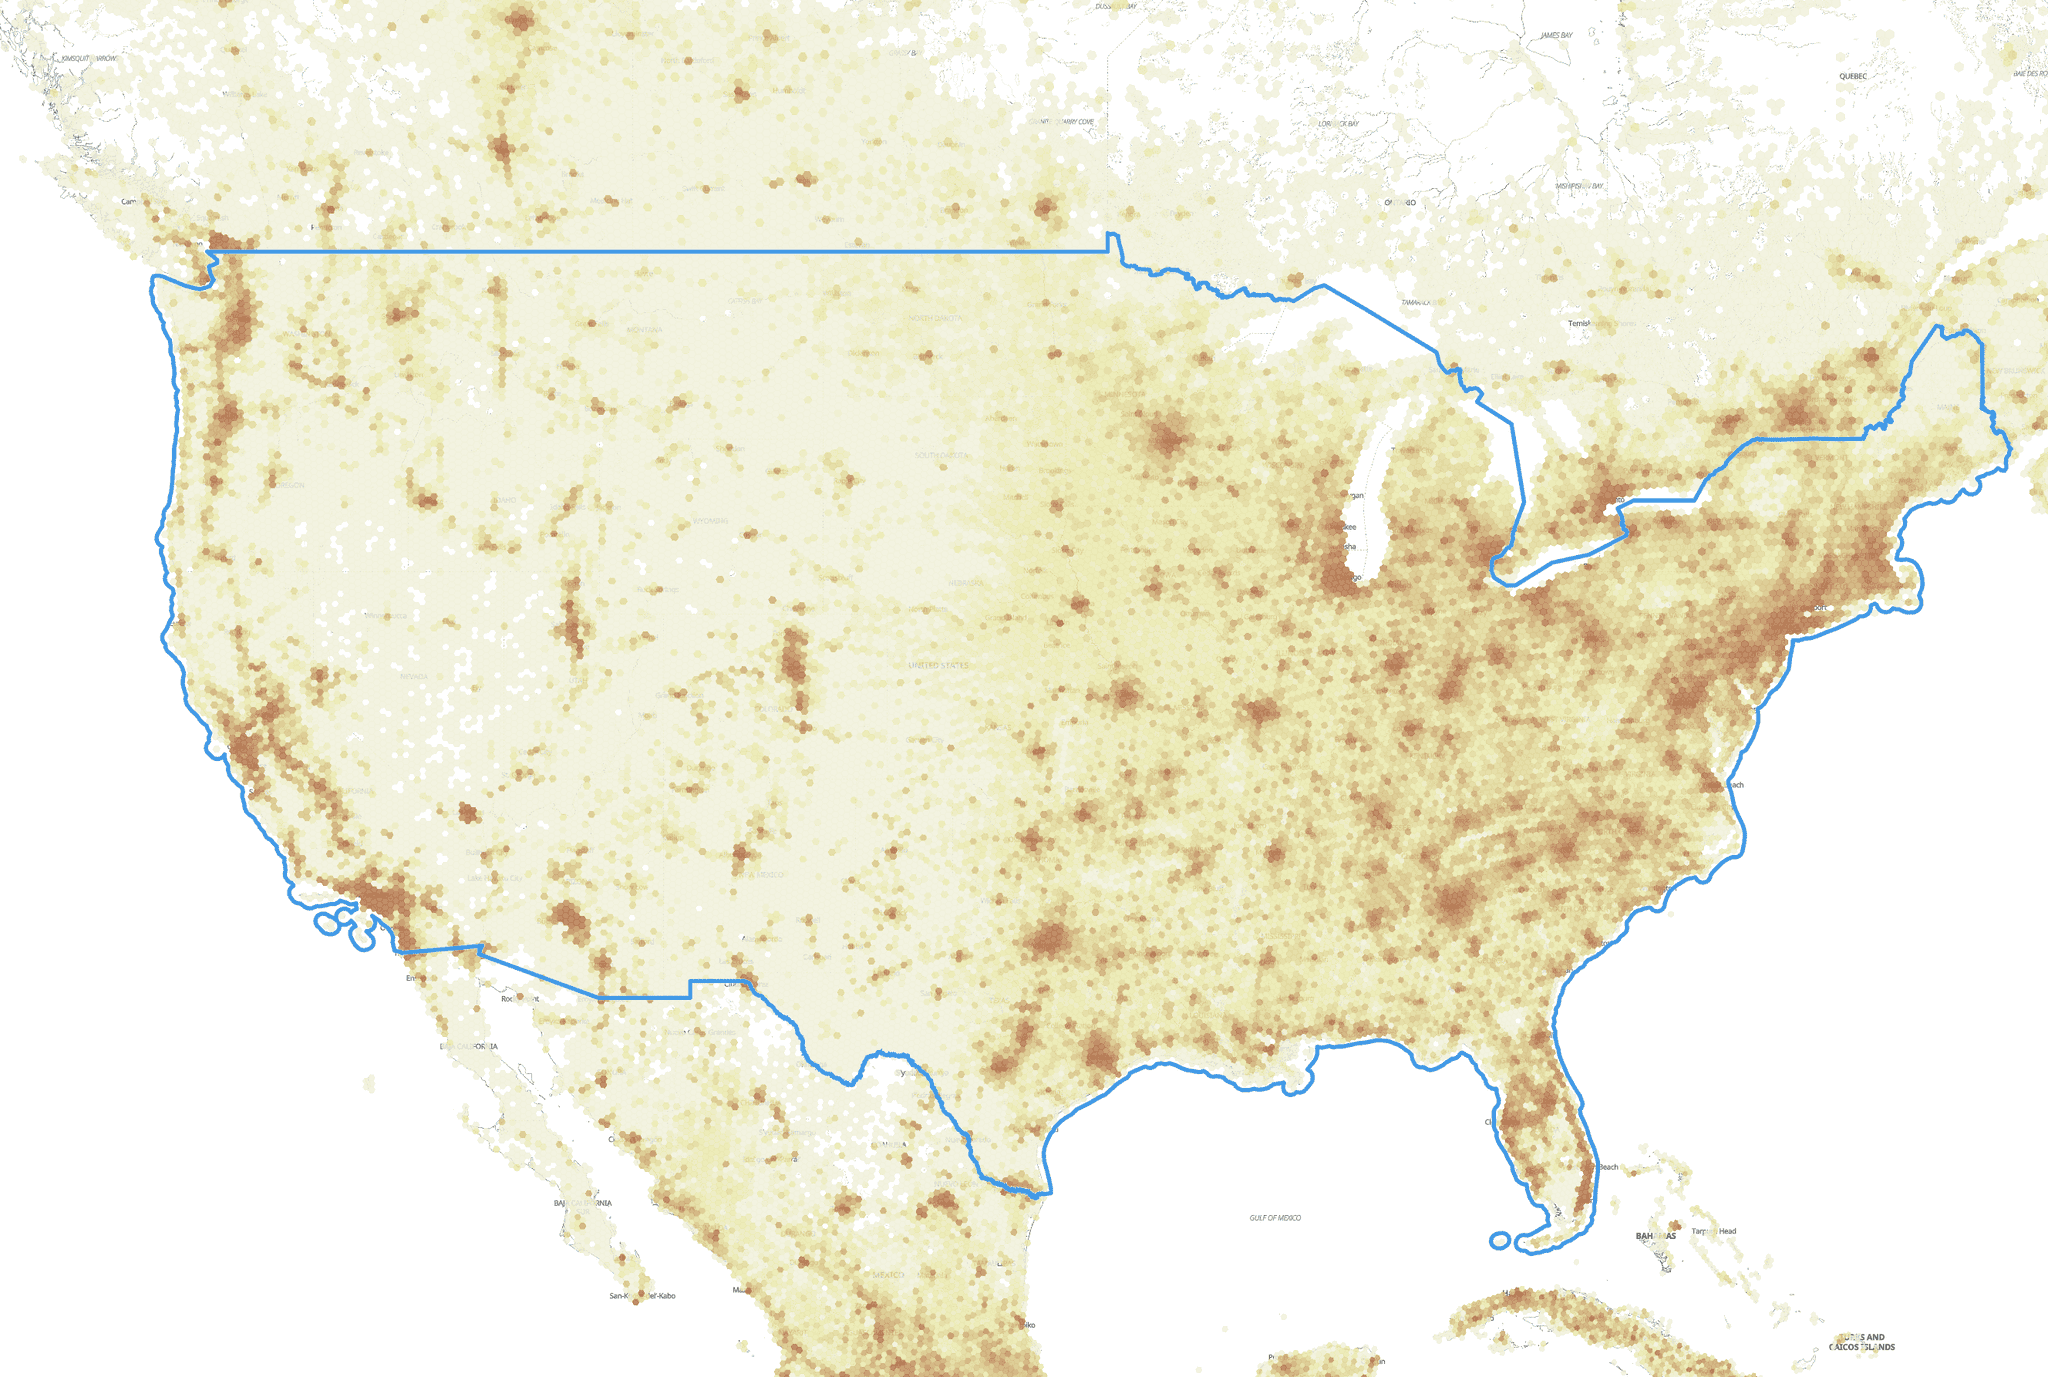
World population density map
The world population density map shows the distribution of people across the globe, with higher population densities typically concentrated in urban areas and lower densities in rural areas.
For business
If you require custom processing or a higher-resolution version of this dataset.
For GIS developers
You can use this dataset mapped to 400m H3 hexagons for free to elevate your projects.
For non-developers
Subscribe to Atlas to access to this and many other layers using our platform without your own development.
You can leverage our datasets in the following ways:
Geoplatform
For users who prefer a visual interface and interactive work with data, try Atlas.
$100..1000/month
API
For developers and companies integrating geodata into their systems.
$100/month
Embedded Map
For companies that need to quickly embed geodata into webpages or internal systems.
$100/month
File dump
For those who prefer to receive ready-to-use files (*.gpkg, *shp, *.geojson, *.csv, and others).
$1000/download
Kontur population dataset
Grid system
Kontur Population dataset is represented by H3 hexagons with population counts at 400m resolution. We use the H3 grid instead of the common square grid because hexagons maintain equal distances between a hexagon’s center and the centers of its neighboring cells. This property greatly simplifies analysis and gradient smoothing.
Data sources
Population calculations are based on the Global Human Settlement Layer (GHSL) – a framework relying on a large set of sensors, including radar and optical public and commercial missions.
GHSL data is overlaid with Facebook population data (HRSL) where available.
Microsoft Building Footprint, Land Information New Zealand, and Copernicus Global Land Service data are used to improve distribution accuracy.
Improving
data accuracy
Known artifacts of GHSL and HRSL datasets are constrained using OpenStreetMap data. The presence of buildings, or built-up areas, suggests human activity, which is often missed in Facebook’s Africa data. Quarries and big roads are marked as unpopulated, as they are often falsely detected as populated in GHSL. Lakes, rivers, glaciers, sands, forests, and other alike land uses are marked as unpopulated.
While the population total is accurate, extremely populated cells (i.e., 500,000 people in .25 km²) are spread out to neighboring cells to satisfy constraints. Non-integer population counts are rounded to the nearest whole number.
The latest version of Kontur Population is available at data.humdata.org.
Use cases

Internal dashboard for analytics

Drone navigation
Ground risk assessment

Assessing crime levels
Humanitarian mapping
The dataset was primarily designed to support visualization behind Disaster Ninja. The tool is actively used by humanitarian mappers to take action confidently based on data correlated with world population density. Read how data correlated with global population density helps support the rapid deployment of emergency mapping campaigns for Humanitarian OpenStreetMap Team.
GHSL data is overlaid with Facebook population data (HRSL) where available.
Microsoft Building Footprint, Land Information New Zealand, and Copernicus Global Land Service data are used to improve distribution accuracy.
Commercial site selection
Using geospatial data analysis significantly reduces the time it takes to find the best location when starting a new business. Reliable population data is a crucial part of such analysis. Read how we used Machine Learning algorithms to detect building footprints from satellite imagery and create a custom population dataset for a site selection project in Abu Dhabi.
Waste management optimization
Our team aimed to apply our geospatial expertise to address local environmental challenges. We teamed up with volunteers in Batumi to help them approach the problem of litter that pollutes streets, parks, rivers, and beaches within the city. We created a bivariate choropleth map to visualize the waste bin availability along with population density within one layer. Service data are used to improve distribution accuracy.
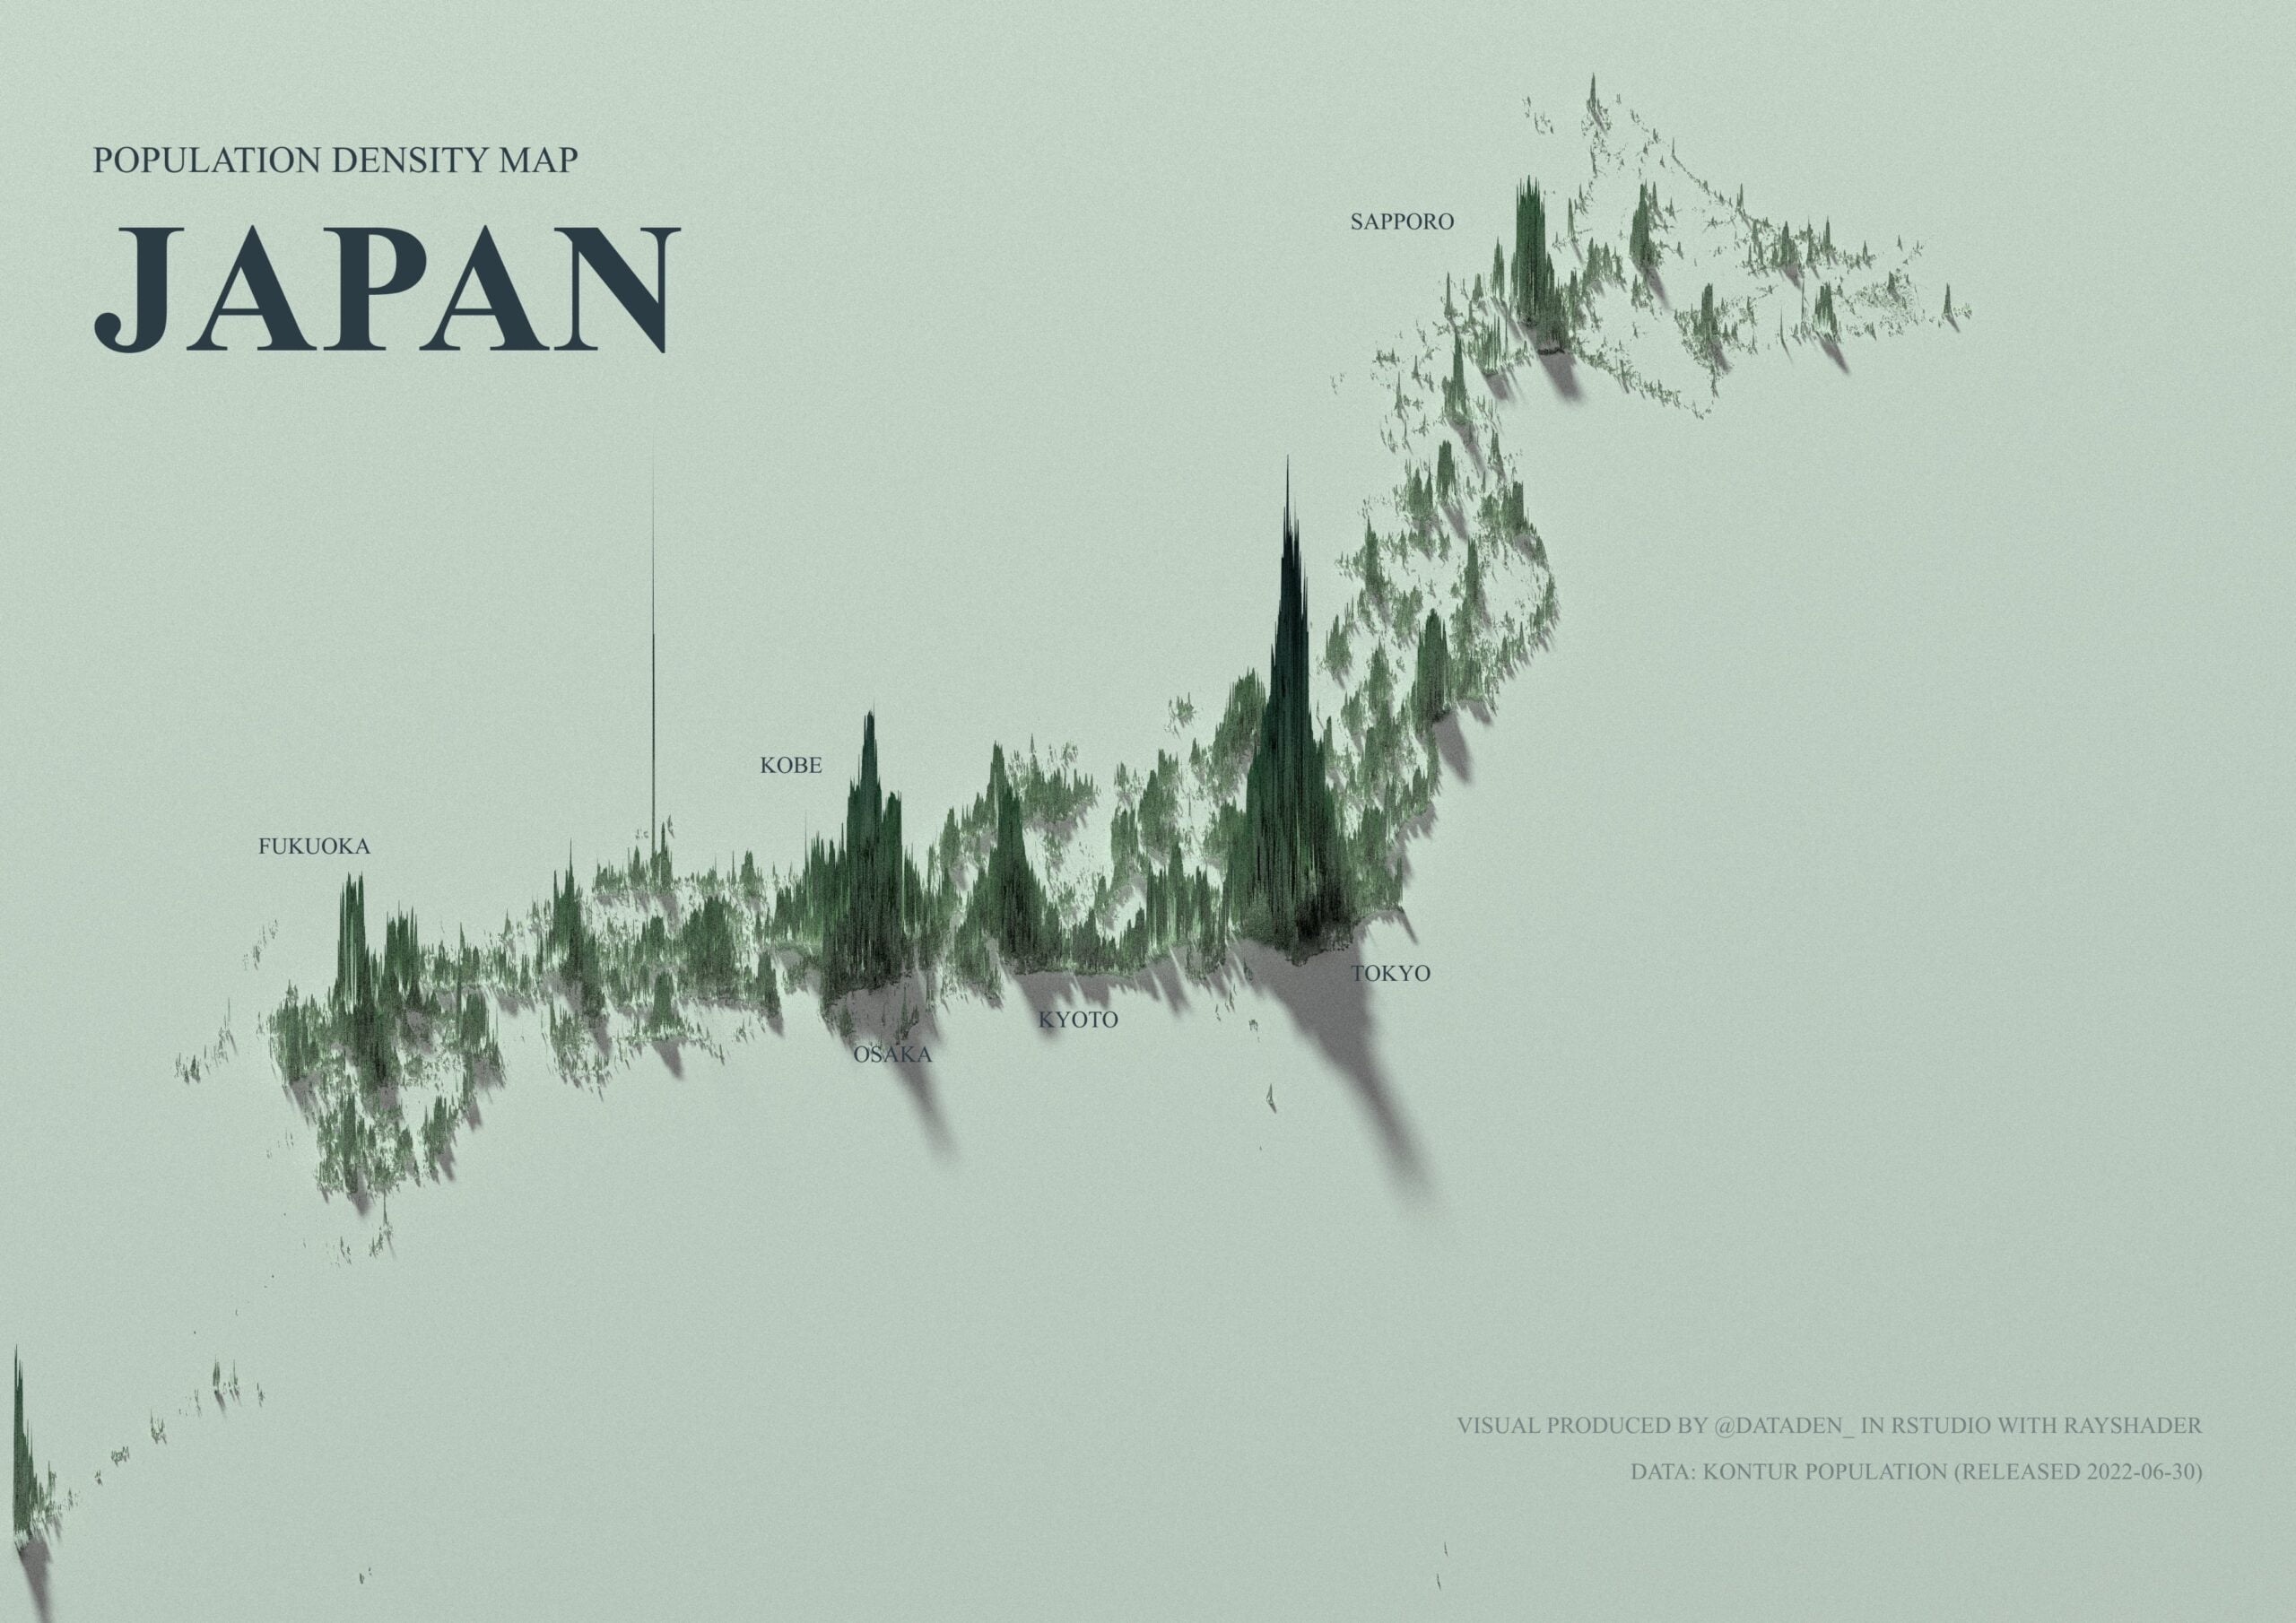
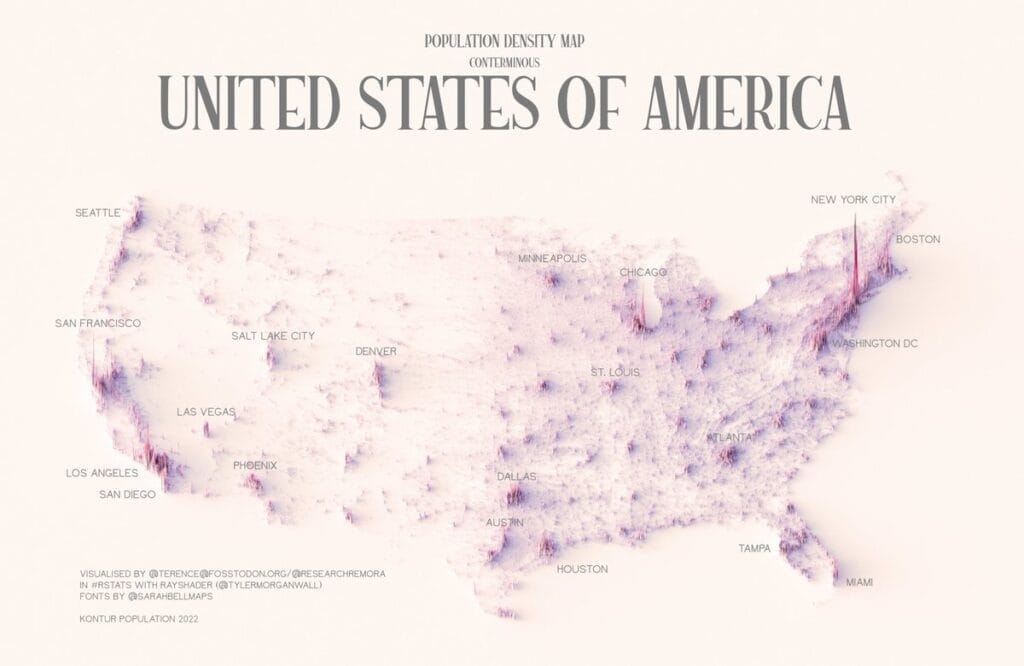
Viral population density maps
Viral visualization
If you’re interested in geodata and data visualization, you can’t help but notice worldwide population density maps going viral and getting hundreds of thousands of views on social media. Many enthusiasts use Kontur Population data to create such maps, which get noticed by media outlets like Colossal.
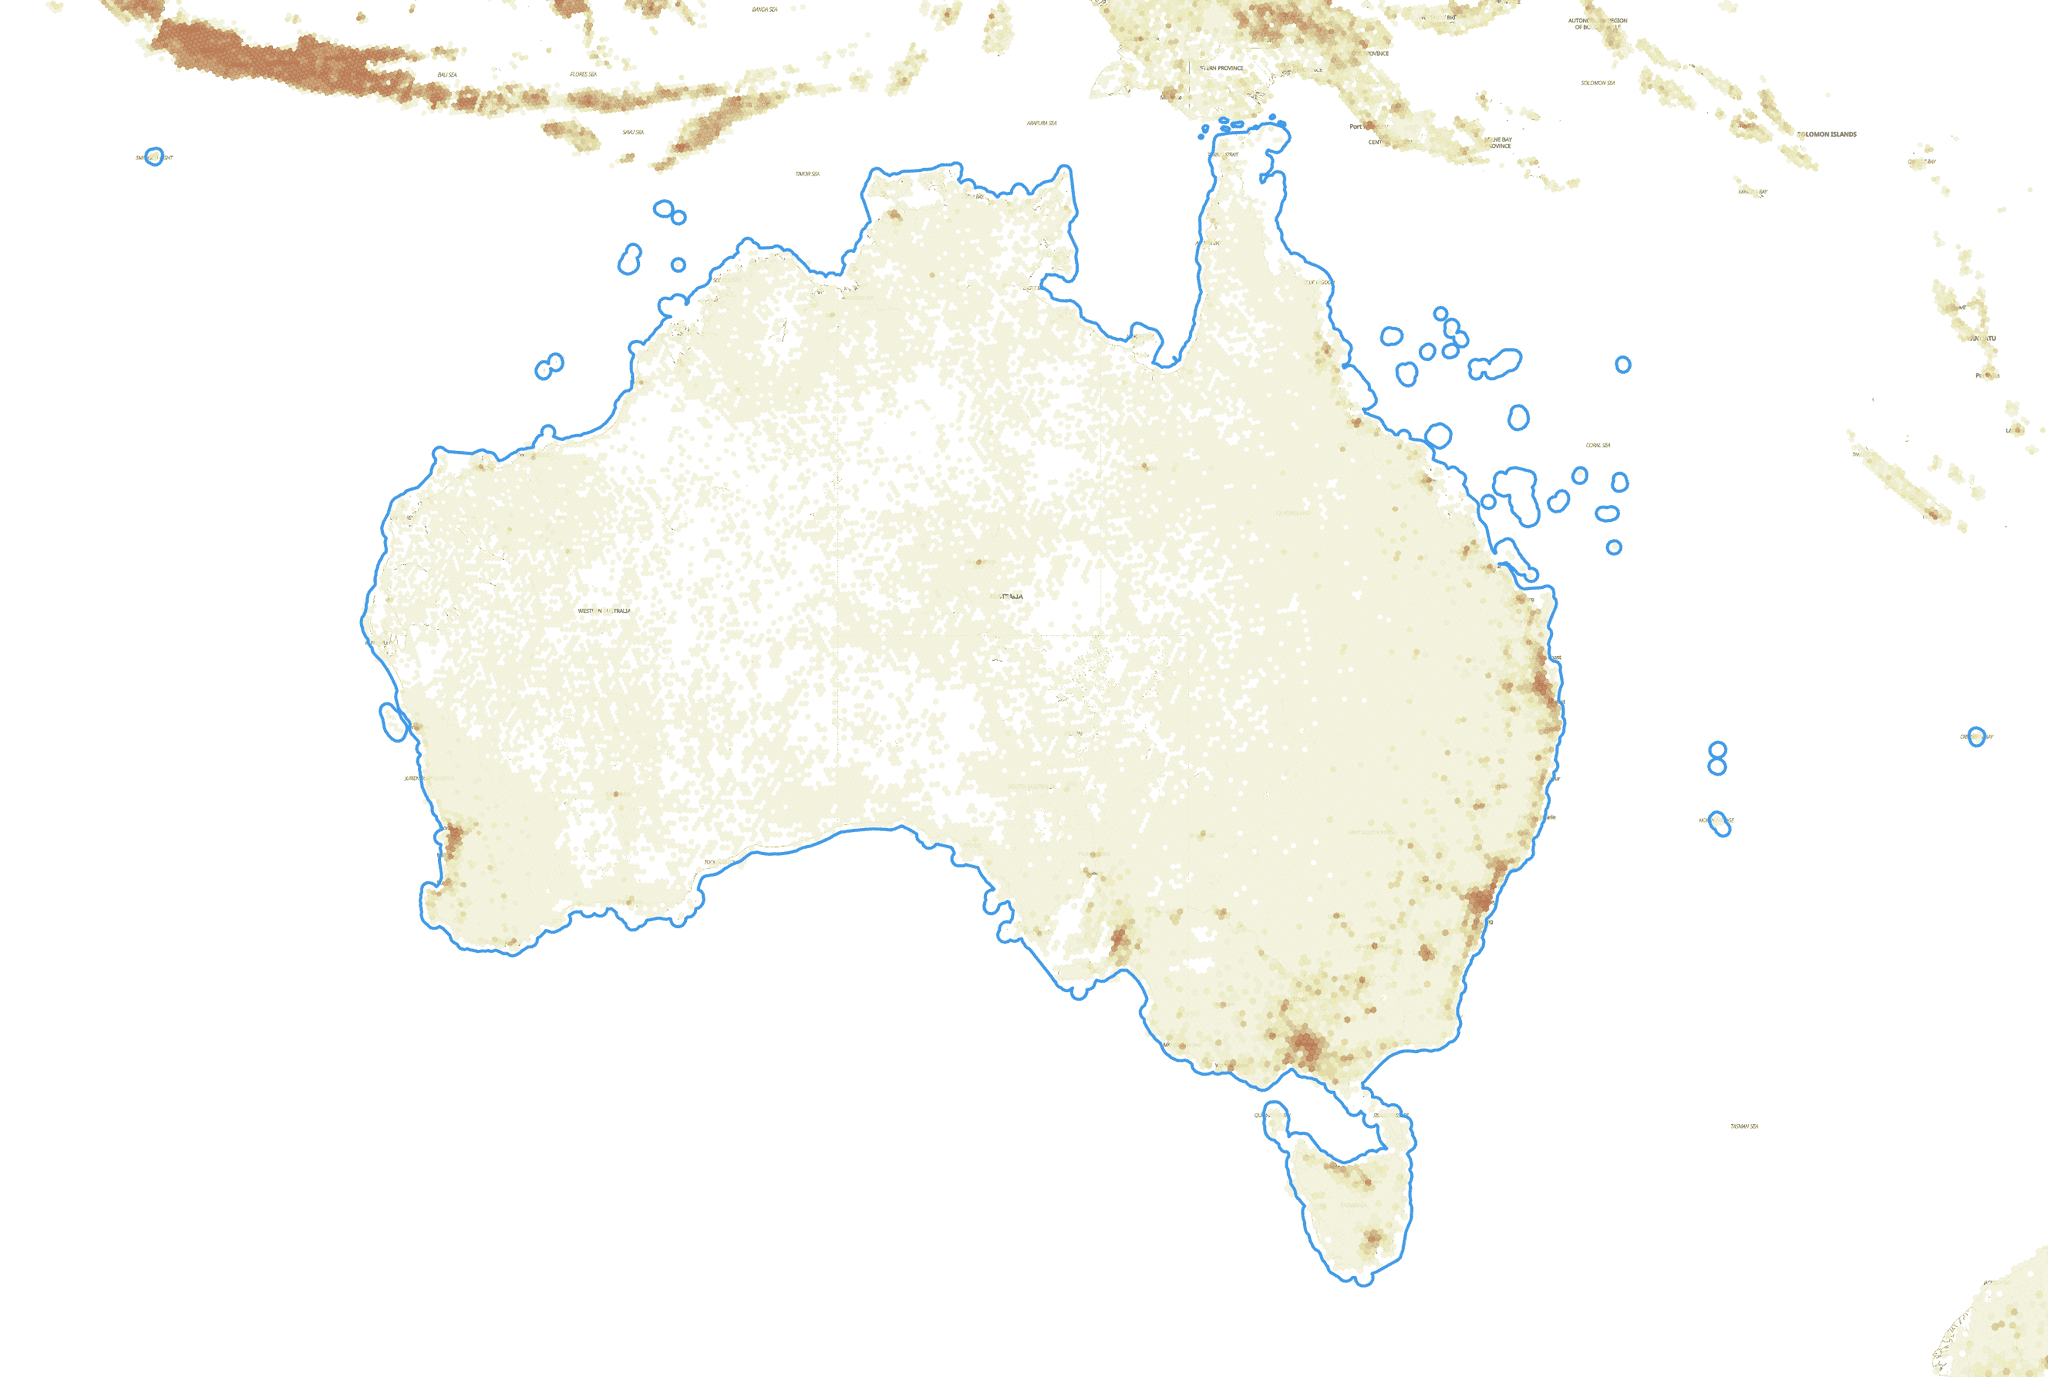
30DayMapChallenge
Population data is applicable for visualization and insight extraction in various domains. Kontur Population became one of the daily topics of #30DayMapChallenge on Twitter. Hundreds of participants use the data to create maps to visualize climate change, flood risk, water security, access to emergency services, and other topics.
Building local population maps
Local population density maps are crucial for city planners and policymakers to make informed decisions about infrastructure, public services, and emergency management. Real estate professionals use these maps to identify trends and make informed decisions about property values and investments.
How to use
The latest version of Kontur Population is available at United Nations Humanitarian Data Exchange (HDX). There are three resolution versions available to download:
– Global Population Density for 400m H3 Hexagons (6.6 GB)
– Global Population Density for 3km H3 Hexagons (169 MB)
– Global Population Density for 22km H3 Hexagons (6 MB)
We also publish per-country subsets of Kontur Population at 400m resolution.
You can also explore and get the data from our partners’ data catalogs:
Kontur Population in Foursquare Studio
Kontur Population at CARTO Spatial Data Catalog
If you require custom processing or a higher-resolution version of this dataset, please contact us.
Kontur Population is available under Creative Commons Attribution International (CC BY) license. You can use it for any purpose, even commercially.