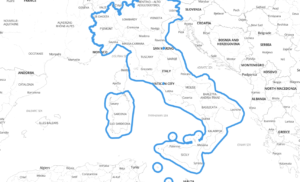
Insights generated using Kontur Atlas
We gather data relevant to your area of interest
Select data showing the most significant changes compared to global averages or other specified regions
We provide AI-driven insights based on this data
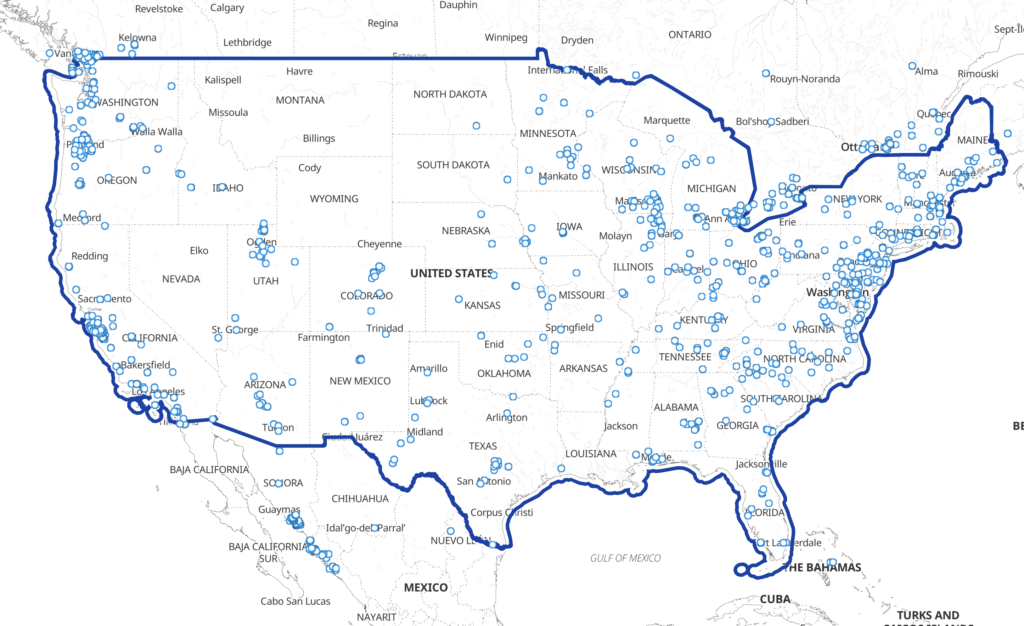
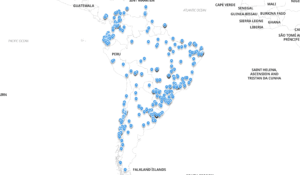
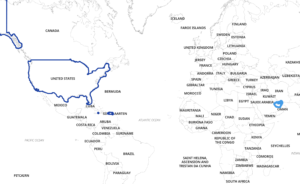
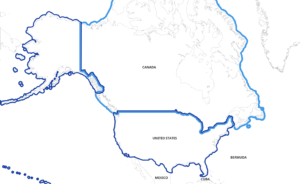
📈 Analyzing Your Selected Greenhouse Horticulture Area Compared to the United States
🌿 Vegetation and Landcover: Your selected area has very low herbaceous vegetation cover at 0.01 sq km per person, compared to 4.37 sq km per person in the US. This indicates scarce natural plant cover and possibly extensive cultivated or built-up land, likely due to the predominant greenhouse horticulture usage. Similarly, there is no shrubland and evergreen needleleaf forest coverage, making it quite barren in terms of natural vegetation.
🛣️ Infrastructure: Your area’s total road length per population is extremely low at 184.49 km per person, compared to a whopping 13,103.96 km per person in the US. This suggests limited road infrastructure in the selected area. Additionally, the total road length per square kilometer is significantly higher at 9,216.90 km, indicating a densely roaded, though less populated setting, suitable for logistical operations of greenhouses.
📊 Economic Indicators: The GDP per area in your selected region is $27,926,550.44 per sq km, which is substantially higher than the US average of $2,859,511.59 per sq km. This reflects the high economic productivity per unit of area, likely driven by intensive horticulture activities.
🏘️ Population Density: The area is highly populated with 425.23 people per sq km compared to the US average of 42.36 people per sq km, highlighting dense residential or worker population likely needed for greenhouse operations.
🚧 Road and Building Data: There’s a noticeable scarcity of newly edited roads in OSM with only 51.65 km per person recently updated, against 593.99 km per person in the US. There are also relatively fewer OSM buildings (130.42 per sq km vs. 9.97 per sq km in the US), indicating limited recent urban development but significant past construction efforts.
🌲 Cover and Height: The forests in your area have a lower forest canopy maximal height of 18.07 meters compared to the US at 23.70 meters, signifying less mature tree growth.
⛪ Cultural and Community Infrastructure: The area has a higher concentration of cultural and community centers, with 1.66 per sq km compared to 0.03 in the US, focusing on community services likely for the worker population engaged in horticulture.
💡 Nighttime and Accessibility: Nighttime lights intensity is higher in your area, indicating well-lit surroundings, essential for greenhouse operations. Proximity to densely populated areas is only 950.18 meters compared to 35,214.05 meters in the US, indicating close proximity to urban centers, essential for workforce and logistics.
💰 Poverty and Economic Well-being: The indicator for families below the poverty line is significantly higher at 14.76 per sq km than the US average of 1.13 per sq km, signaling economic challenges in the workforce community.
🌦️ Climate and Environmental Suitability: Your area has a good suitability for solar farm placement (score of 0.65) compared to the US (0.51), making it attractive for renewable energy initiatives leveraging the available solar irradiance.
🦠 COVID-19 Cases: The number of COVID-19 confirmed cases per area and per population is high at 109.36 per sq km and 0.24 per person respectively, highlighting a significant health impact, possibly due to the high population density.
🏠 Building Data: The density of OSM buildings and recent edits point to a well-documented but somewhat aged demographic profile of building data, with ongoing improvements needed for up-to-date infrastructure representation.
In conclusion, your selected greenhouse horticulture area is high in economic productivity per area but faces challenges in infrastructure and socioeconomic indicators. Its dense population, proximity to urban centers, and high economic output make it a focal point for intensive horticultural activities. However, investment in infrastructure, community welfare, and health systems is recommended to support sustainable development. 🤝

