Atlas login
Insights generated using Kontur Atlas
We gather data relevant to your area of interest
Select data showing the most significant changes compared to global averages or other specified regions
We provide AI-driven insights based on this data
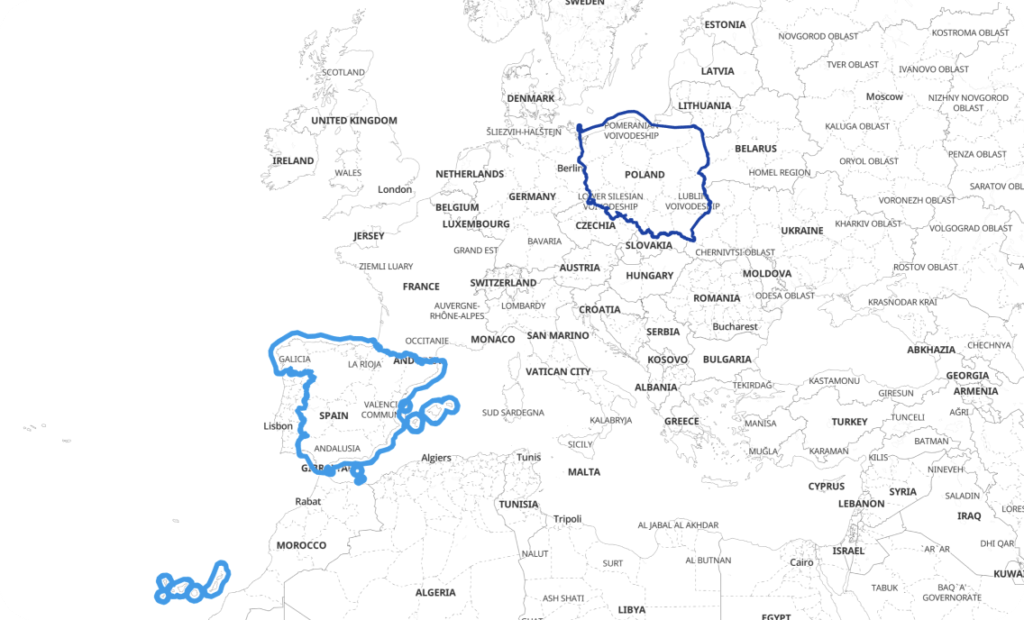
Comparing your selected area, España, to your reference area, Polska:
- 🌳 Forest and Vegetation:
- Forest cover in Spain has a higher unknown forest type (0.31 in Spain vs. 0.08 in Poland).
- Spain’s forest canopy height is significantly lower (3.73 meters avg., compared to Poland’s 9.21 meters).
- The maximum canopy height is also lower (8.43 meters in Spain vs. 16.78 meters in Poland).
- NDVI in Spain is lower (0.37 in Spain vs. 0.68 in Poland), suggesting less dense vegetation.Cropland cover is lesser in Spain (0.27 vs. 0.49 in Poland).
- 🌞 Climate and Agriculture:
- Global Horizontal Irradiance (solar potential) is much higher in Spain (4.50 W/m² compared to 2.97 W/m² in Poland). This indicates better suitability for solar farms.
- Air temperatures are higher in Spain, with max average temperatures of 27.23°C compared to Poland’s 22.52°C.
Drought exposure is significantly higher in Spain (73.75 days vs. 23.29 days in Poland), impacting agriculture and water resources.
- 🌲 Land Use and Cover:
- More shrubland in Spain (0.12 vs. close to zero in Poland).
Lesser percentage of populated area in Spain (0.39 compared to 0.68 in Poland).
Lower building density in Spain (8.74 buildings/km² vs. 53.55 buildings/km² in Poland).
- More shrubland in Spain (0.12 vs. close to zero in Poland).
- 🏫 Urban Infrastructure:
- OSM road length edited recently is lower in Spain (0.33 km/km² vs. 0.59 km/km² in Poland).
- Historical sites and museums also fewer in Spain (0.10/km² vs. 0.49/km² in Poland).
- 🌡️ Temperature Extremes:
- Days above 32°C under future climate scenarios are much higher in Spain (43.08 days for +2°C scenario vs. 3.73 days in Poland).
- 🌍 Population and GDP:
- Population density is lower in Spain (85.91 people/km² vs. 127.31 people/km² in Poland).
- GDP per capita is higher in Spain ($25,938.47 vs. $16,073.85 in Polan
- 🌿 Disaster Readiness:
- Exposure to all disaster types is higher in Spain (73.75 days vs. 23.29 days in Poland).
- Man-distance to hospitals is greater in Spain (22.77 man-distance per person compared to Poland’s 14.50).
- ⛏️ Natural Resources and Exploitation:
- Forest type variability and lower evergreen needleleaf cover indicate more diverse but lesser dense forests in Spain.
- Elevation is much higher on average in Spain (627.34 meters compared to 166.72 meters in Poland).
- 🏥 COVID-19 Impact:
- Confirmed COVID-19 cases per population are higher in Spain (0.29 per person vs. 0.16 per person in Poland).
Key takeaways to consider:
- Spain’s warmer climate and higher solar potential could be advantageous for renewable energy projects.
- Lower NDVI and higher drought exposure in Spain indicate more arid conditions.
- Urban infrastructure is denser in Poland, while Spain appears less densely urbanized.
- Higher GDP per capita in Spain suggests a stronger economy, but higher disaster exposure implies greater vulnerability.
🌍 Given the differences, when travelling from Poland to Spain, expect a warmer, more arid climate with higher solar potential and less dense urban infrastructure, but be aware of greater drought and disaster exposure.