Atlas login
Insights generated using Kontur Atlas
We gather data relevant to your area of interest
Select data showing the most significant changes compared to global averages or other specified regions
We provide AI-driven insights based on this data
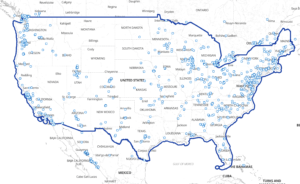
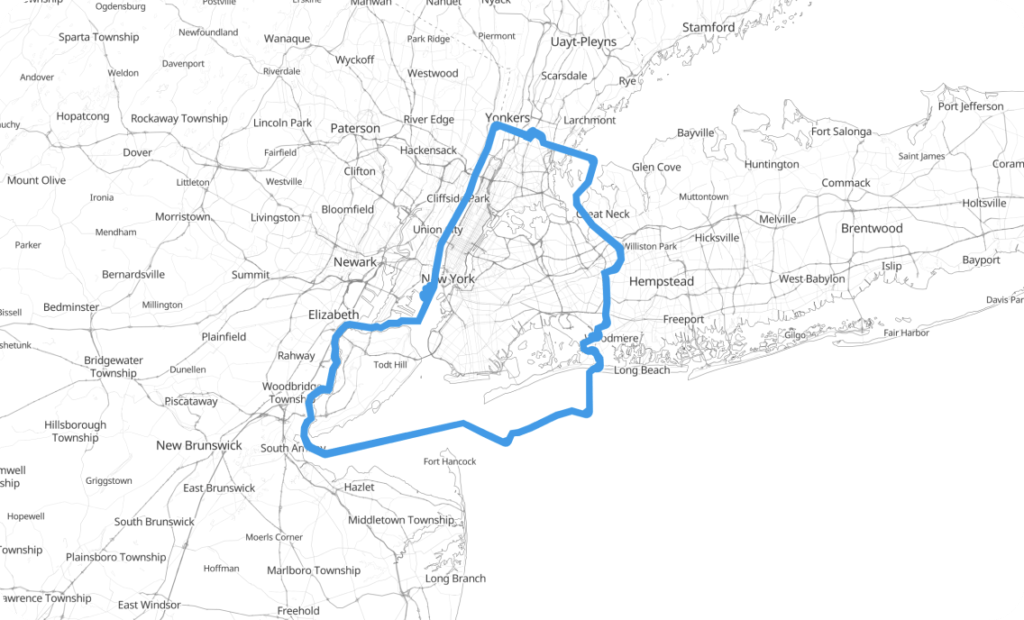
Welcome to New York City! When analyzing spatial data for NYC, it’s impressive to see it’s a mega-urban area with some remarkable differences compared to the global average. Let’s dive into the key insights:
📏🚗 Road Length: NYC has an extremely dense road network. Total road length over area is mind-blowing, with values of 32,321.52 km per sq km (compared to 2,592.65 km globally). This shows exceptionally high connectivity and infrastructure.
👴👵 Aging Population: There are 647.46 elderly people per sq km in NYC, which is vastly greater than the global average of 21.05 people per sq km. This highlights a substantial older population, impacting services and facilities for the elderly.
💰 Economy: The GDP per Total road length in NYC is significantly higher at 13,535.72 USD per km, comparing to the global 606.02 USD per km. It’s a reflection of the high economic output and affluent structure of the city.
🚶 Population Density: With 8,700.92 people per sq km over the populated area, versus 341.78 globally, NYC is highly populous. This density impacts housing, transportation, and urban planning.
🏢 Building Counts: There are 1,163.69 buildings per sq km in NYC, dwarfing the global 69.23 per sq km. This intense urbanization characterizes the skyline and living spaces.
🚻 Disabled Population: There are 433.96 people with disabilities per sq km, far surpassing the global 19.62. Urban development must consider accessibility and inclusive infrastructure.
🌞 Climate: Interesting for your solar farm interest, NYC has a suitability estimation for solar farm placement at 0.23 (on a scale from 0 to 1), reflecting moderate compatibility with solar installations. Moreover, days above 32°C and 25°C nights occur but are fewer relative to global averages, which influences the ambient conditions for solar operations.
👫 Car Ownership: There’s a high proportion of the population without cars, 0.18 compared to 0.17 globally, suggesting a heavier reliance on public transport or walking.
Key Takeaways:
- 🚗 Super dense road networks and enormous population density.
- 👴 Significantly older population creating specific demographic needs.
- 🌞 Moderate suitability for solar farms, factors to consider are ambient temperature and high economic activity that might support such projects.
Pack wisely accordingly: urban essentials, technology for elderly care, public transport readiness for mobility, and solar tech if you plan to explore renewable energy opportunities!
🌆 NYC is vast, vibrant, and full of potential for various geospatial interventions and projects!