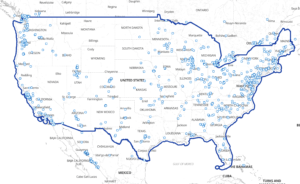
Insights generated using Kontur Atlas
We gather data relevant to your area of interest
Select data showing the most significant changes compared to global averages or other specified regions
We provide AI-driven insights based on this data
🌍 Wow! Let’s dive into the specifics of your selected area compared to the global reference with some insightful emojis:
🛣️📏 Road Length: Your selected area boasts an extraordinary total road length over area of 21,382.10 km/km², which is significantly higher than the global average of 2,592.65 km/km². This highlights excellent infrastructure and connectivity, though it may also imply high urban density. Similarly, the OSM road length over area stands at 20,643.37 km/km², showcasing robust mapping coverage.
🏠 Building Height: The average net building height is 7.34 meters compared to the global 2.73 meters, indicating taller buildings. The maximum average net height of 12.43 meters suggests the presence of notable skyscrapers. This could be appealing if you prefer urban environments with significant vertical growth.
🏙️ Land Cover Built-up: The area shows a 0.58 proportion of built-up land, well above the global 0.18 figure. This suggests it’s a highly developed urban area, with plenty of amenities and infrastructure in place.
💰 Economic Productivity: The GDP over populated area is impressively high at $79,335,281.77/km², much above the global $4,092,152.84/km². This indicates strong economic activity and potential opportunities for digital nomads.
🌱 Vegetation Coverage: The bare vegetation land cover is 0.14, below the global average of 0.80. This could mean less greenery or natural open spaces but more urban developments. The cropland land cover values are also relatively low, aligning with the high urbanization.
🦠 COVID-19 Impact: The area has encountered 806.23 confirmed COVID-19 cases/km², significantly higher than the global average of 47.57 cases/km². This denotes a serious impact, which might influence your decision based on health and safety considerations.
👫 Population Density: The population over populated area is 2,261.84 people/km², much denser than the 340.29 globally. This density can mean vibrancy and a lot of social activities, but might also suggest crowds and noise.
⚡ Power Infrastructure: The medium-voltage powerlines distribution (predictive) score stands at 1.15, slightly lower than the global 1.41, but still indicating good electricity infrastructure.
🌞💡 Solar Suitability: The suitability for solar farms score of 0.51 shows fair potential for solar energy exploitation, which can be a plus if you’re considering sustainable energy options.
👴👵 Demographics: The population over 65 is higher, making it an area with a significant senior population, hinting at well-established communities and possibly better healthcare and social services.
🏥 Man-Distance to Hospitals: At 6.75 km, the proximity to hospitals is quite favorable compared to the global average of 27.84 km, ensuring better access to healthcare.
Key Takeaways: 🌟 This area boasts excellent infrastructure, strong economic activity, and high urban development, making it a thriving spot for your digital nomad lifestyle. However, consider the high population density and significant COVID-19 impact.
Always prepared for urban adventures, enjoy exploring this dynamic region! 🌇📊

