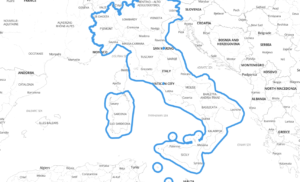
Insights generated using Kontur Atlas
We gather data relevant to your area of interest
Select data showing the most significant changes compared to global averages or other specified regions
We provide AI-driven insights based on this data
🚧 Road Density & Mapping Activity
🚧 Incredible Road Density: The total road length over the area is a whopping 19,209.50 km per square km, which is over 7 times the global average! This suggests a highly urbanized region with extensive infrastructure. Similarly, the OSM road length is quite close at 18,949.61 km per square km, indicating excellent mapping coverage in OSM.
🛤️ Extensive Road Length: This area’s road length per populated area is unprecedented, at almost 5.4 times above the global mean. If you rely on road networks, you’re in a very well-connected space!
🌇 Urban Development
🏙️ High Building Structures: The average net building height stands at 12.54 meters, significantly taller than the global average of 3.08 meters. This means you’ll see much taller buildings here.
🏢 Abundance of Buildings: The number of buildings over the populated area is 555.43 per square km, which is about 8 times the global average, pointing to a densely built environment.
👥 Population & Density
👥 High Population Density: At 4,519.01 people per square km in populated areas, this region is extremely densely populated compared to the global average of 340.29 people per square km. Expect a very bustling and active environment.
💉 Covid Impact: The area has experienced 705.72 COVID-19 cases per square km, quite high compared to a global average of 47.46. This could have implications for public health policies and current infrastructure usage.
🌳 Land Use & Vegetation
🏘️ Landcover Built-Up: Landcover built-up in the populated area is 0.61, which is significantly higher than the global 0.18, emphasizing urbanization. However, the forest cover is lower, standing at 0.13 both over area and populated areas.
📊 Economic Indicators
💰 GDP Productivity: The GDP over the populated area is high at $36,575,361.83 per square km—suggesting wealth and economic productivity. However, per capita GDP is $8,087.46, below the global average of $20,349.92, indicating wealth concentration in certain sectors.
💵 Tax Burden: The total tax and contribution rate making up 55% of profit is elevated compared to the global mean, indicating a higher economic burden on commerce.
🌡️ Temperature & Climate Insights
🌡️ Stable Climate: The average air temperature at 20.93°C and a low monthly amplitude of 15.31°C suggests a temperate climate.
🔥 Heat Sensitivity: With the area experiencing 273,552.75 man-days above 32°C in a +1°C scenario, the community is significantly affected by heat, unlike the global trend.
⭐ Nighttime Activity
🌌 Bright Nights: The nighttime lights intensity is 35.46 watts per square cm per steradian, way above the global mean. This implies robust economic activity and vibrant nightlife.
🦺 Safety & Health
🏥 Proximity to Health Services: The area shows impressive proximity to hospitals (6.48 man-distance per person), suggesting good access to healthcare.
🚒 Fire Brigade Access: With man-distance to fire brigade services being 15.92 per person, emergency services are relatively more accessible here than globally.
🏠 Infrastructure & Mapping
🗺️ High OSM Engagement: With OSM mapping and edits being consistently higher, this area benefits from comprehensive and updated mapping data.
🔋 Accessible Charging Stations: The man-distance to charging stations over population is impressively low at 6, reflecting incredible accessibility for electric vehicles.
Key Takeaways
🔲 Urban Density and Infrastructure are highly developed. 👥 High Population Density influences local infrastructure and services. 🌡️ Temperature Stability combined with notable heat sensitivity. 💰 High GDP Productivity but with a relatively high tax burden.
These insights should equip you with the essentials for understanding the dynamics of your selected region compared to global averages. Safe travels and happy analyzing! 😄📊

