Atlas login
Insights generated using Kontur Atlas
We gather data relevant to your area of interest
Select data showing the most significant changes compared to global averages or other specified regions
We provide AI-driven insights based on this data
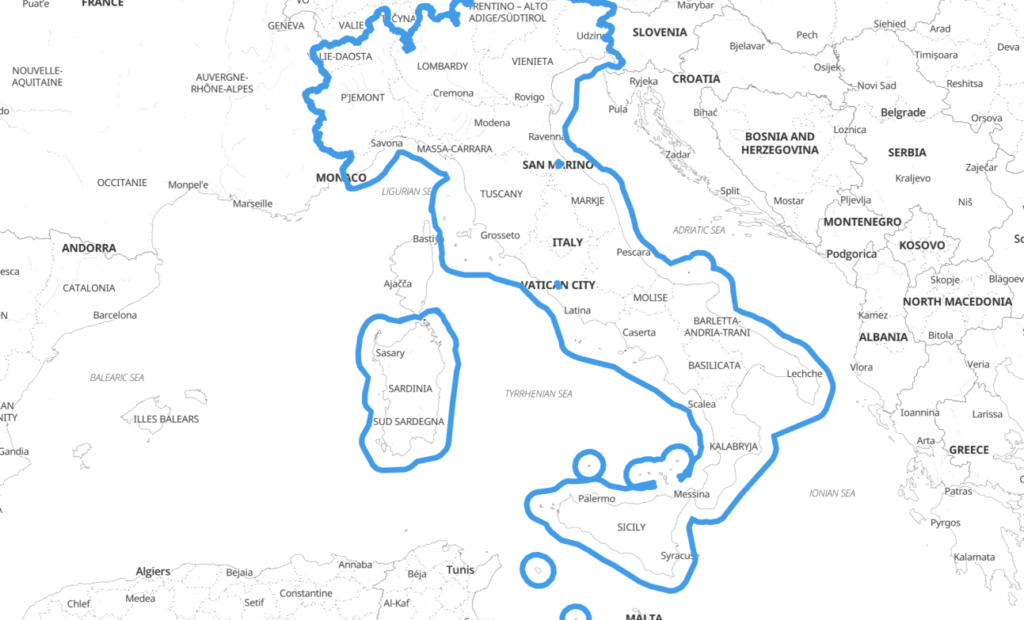
🌍 Welcome to the comprehensive review of the selected region, Italy! Here’s a breakdown of the key indicators and insights comparing Italy to the global averages:
🏠 Population Density: The populated area over the total area in Italy is generally well-dispersed with an average of 0.81, slightly lower than the global mean of 1.00. This could indicate a balanced urban-rural mix.
🌿 Landcover and Vegetation:
- Bare Vegetation: Only 0.14 of the area is bare vegetation, far less than the global average of 0.80, suggesting Italy is well-covered with greenery.
- Forest Coverage: Italy has significant forest landcover both over populated areas and in general, higher than global averages. This reflects a robust natural green cover.
🔥 Wildfire Exposure: The region experiences fewer days of wildfire exposure (2 days) compared to the global average of 12.76 days. 🧯 This implies a relatively safer environment regarding wildfires.
🌋 Volcanic Activity: The average number of volcanoes in the area is slightly higher than the global average, an essential consideration for disaster preparedness and tourism.
🛡️ Safety: Italy’s safety score according to the Global Peace Index is 1.91, which is less favorable compared to the global average of 1.28. 📉 This might indicate a need for alertness and better safety measures.
🚗 Transportation Network:
- Road Length: The total road network is extensive at 4,945.22 km per square kilometer, significantly exceeding global averages. This suggests excellent infrastructure.
- Road Length over Population: At 1,007.05 km per person, it showcases well-distributed road systems relative to the population, enhancing mobility.
💡 Solar Power Potential: The suitability score for solar farms is 0.43, nearly double the global average. 🌞 This indicates good prospects for renewable energy investments.
🏭 Proximity to Power Infrastructure: The region benefits from closer proximity to power substations and powerlines, supporting reliable energy distribution networks.
🌡️ Climate Resilience:
- Temperature Extremes: Days above 32°C are fewer in Italy (20.54 days) under the +1°C scenario compared to global trends, implying a more temperate climate.
- Drought: The region faces 297.12 days of drought exposure annually, higher than the global average, pointing to significant periods of dry conditions.
🦠 COVID-19 Impact: A higher rate of confirmed cases, with 0.46 cases per person, reflects a significant pandemic impact, potentially affecting public health and economics.
🏛️ Cultural and Community Resources: The number of cultural and community centers, entertainment venues, and historical sites is lower than global norms, suggesting room for enhancing cultural infrastructure.
➡️ Key Highlights:
- Extensive Road Network 🚗
- High Forest Coverage 🌳
- Lower Wildfire Exposure 🔥
- Potential for Solar Energy 🌞
- Higher Disaster Exposure and Safety Concerns 🚨
🧳 Travel Advisory: If traveling from areas with lower road density or greener covers, prepare for Italy’s sophisticated road infrastructure and planned urban setups. Climate-wise, expect fewer extremes in temperature but be aware of possible longer periods of drought.
Overall, Italy presents a mixed picture with strong infrastructure, significant green cover, and moderate climate but faces challenges in disaster preparedness, cultural amenities, and health impact from recent global events. Maintain vigilance and take advantage of the region’s potential for renewable energy and mobility. 🌍🌿🚗