by Nadzeya Laptsik and Alexander Chichigin
In Atlas, we have more than 100 data layers, and for each layer, we provide a number of summary statistics like minimum, maximum, mean and so on. That’s a lot of numbers to consider, especially when you’re comparing two regions to one another and the overall World characteristics. It would be nice if the system could sift through all the data and pick up the most significant and relevant features pertaining to the comparison and the aim at hand. Luckily, we can instruct ChatGPT to do exactly that, and with all of our layers and a bit of apt prompting, we’ve moved from conventional statistical methods to deeper personalized insights.
Bringing AI into Our Analytics
ChatGPT enhances our AI analytics feature, improving the robust data analytics we already provide. We start by summarizing key indicators — such as maximum, minimum, average, etc. — for selected areas. This data is then compared to global figures and user-specified references.
Once we have this summary, ChatGPT analyzes the data to highlight key insights relevant to the user’s profile and preferences, such as occupation, analytics preferences, and interest in geospatial analysis. This personalized approach ensures that whether you’re a business professional, decision-maker, student, educator, or spatial analysis expert, you receive relevant and valuable insights.
Typical Geospatial Analysis Workflow
Usually, GIS analysis involves several challenging and tedious steps.
First, you have to figure out what data can in principle answer the question at hand, then you have to find sources for the data, clean it up, and possibly reshape and integrate.
As the second step most often you calculate some summary statistics from the data collected over the areas of interest. Conceptually, this is a simple and straightforward task, but in practice it might take a couple of iterations to get it right due to missing data, outliers, data anomalies, and alike, which might be exacerbated by the sheer volume of data and the time it takes to process.
Then comes the creative part: you compare statistics, perform significance tests and draw your conclusions. The catch is, you might realize you still miss some foundational data to make a definitive decision, which brings you all the way back to the step one.
Finally, you may need to write up some report or prepare a presentation for non-technical stakeholders or decision-makers.
Even without any AI, Atlas automates away the first two steps: we already have many cleaned-up, high-quality data layers that are easy to use and integrate, and we pre-calculate all the major summary statistics in a robust way.
You can immediately jump into the creative part:
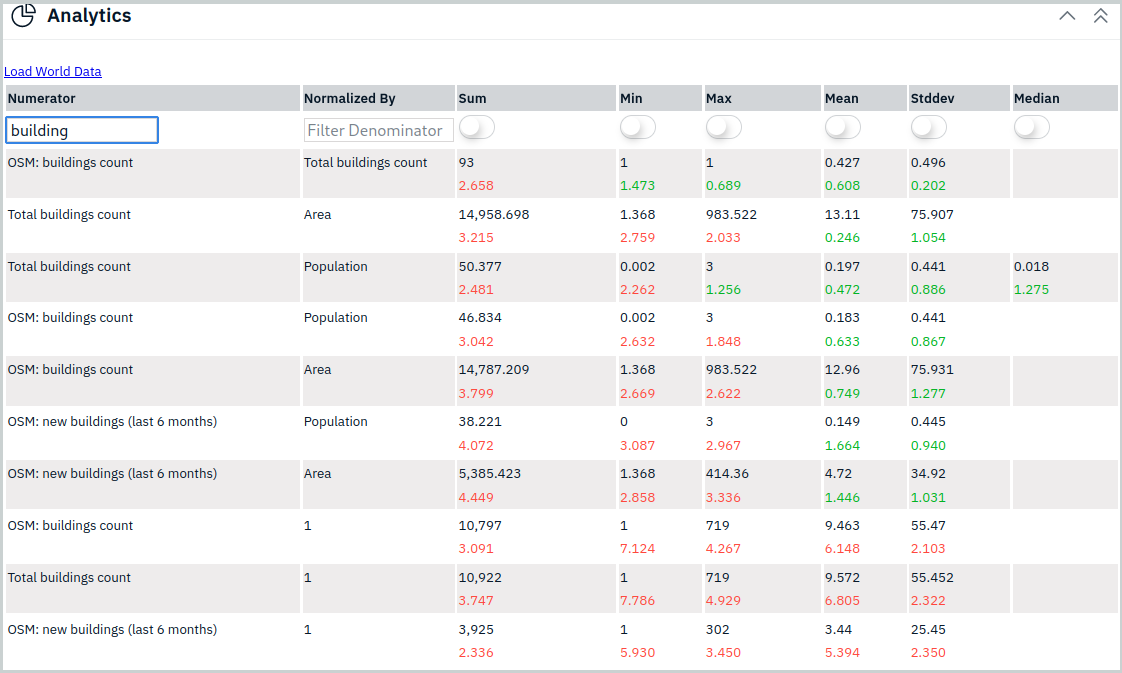
Well, maybe it’s not that creative when you still have to sift through lots of numbers… This is particularly problematic and time-consuming for exploratory analysis, where your goal is to figure out what’s important for the task at hand in the first place.
From Data Overload to Clear Insights
This is where ChatGPT steps in. With huge context windows of recent versions, it’s able to process enormous volumes of data, covering both area of interest-specific statistics and overall World statistics for comparison. Then, to help the LLM pick up the most important indicators out of hundreds, we provide it with standardized statistical scores where appropriate, to enable scale-invariant significance sorting.
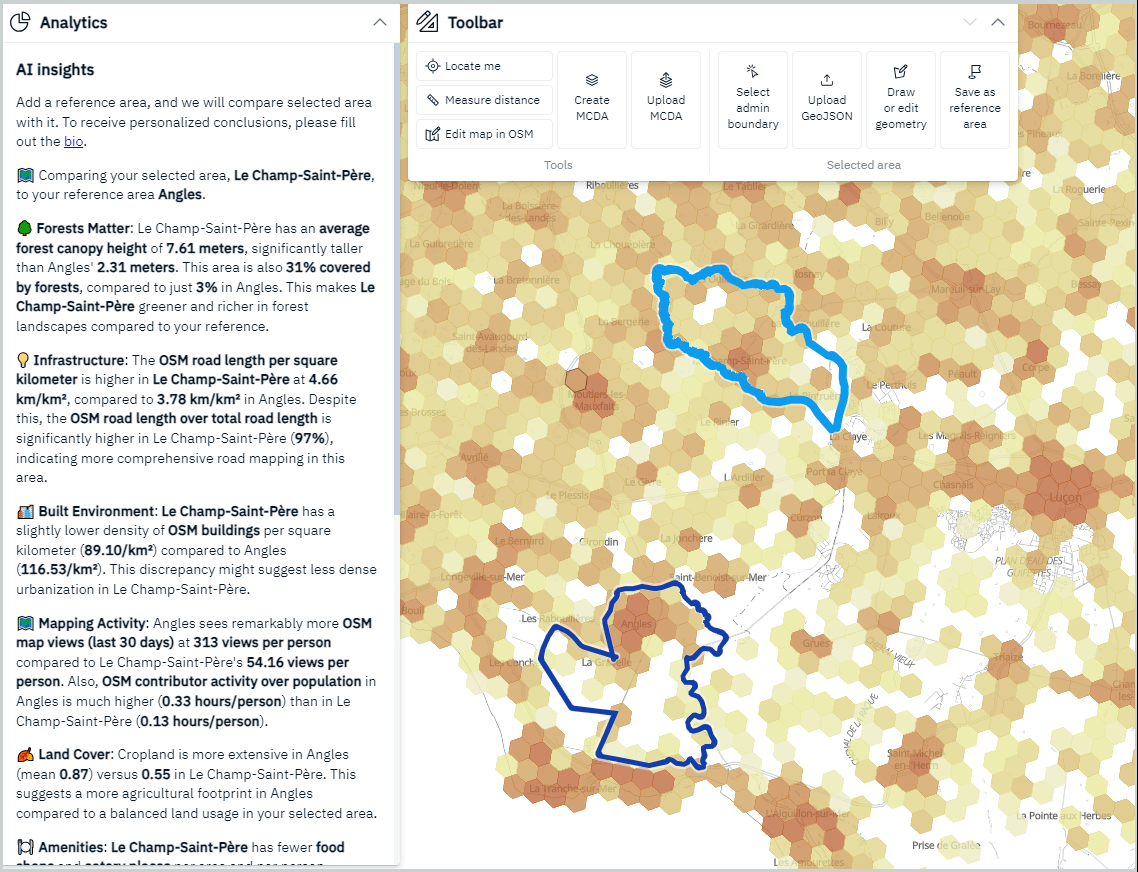
The end result is a nice short summary formatted as Markdown, structured by topics or data layers, and highlighting most significant and most interesting differences between regions of interest. Such write-ups can be easily understood and interpreted even by novices and may serve as a seed for a more thorough and professional analysis.
And you can make the output more relevant and personalized by giving appropriate hints in your bio: what’s your background, what regions you’re familiar with, what’s your job, what’s the task you’re working on, what’s your angle and what factors are the most interesting for you.
LLMs demonstrate unprecedented abilities to understand and produce natural language, great breadth of knowledge and competent reasoning. Still, they can’t know everything. Thus, to elicit the best output from ChatGPT one needs three things: current high-quality real-world data, adept guidance in the prompt, and user-provided goals and values. These are the areas we focus on and leverage at Kontur. We believe that our expertise amplified by AI can greatly simplify and democratize GIS analytics in the nearest future.

